
This piece was published in the 27th print volume of the Asian American Policy Review.
Abstract
This paper examines wealth distribution and ethnically structured inequality among Asian American elderly. This paper uses three different datasets—the Survey of Income and Program Participation (SIPP), Health and Retirement Study (HRS), and micro-level data from the American Community Survey (ACS)—to examine wealth, home equity, and asset income among Asian American elderly. We also analyze ethnic variations in asset ownership. We find income is highly correlated with the distribution of wealth, although wealth is much more unequally distributed than income. Because the poor have limited assets, their poverty cannot be offset by drawing upon savings. Home equity accounts for more than half of net assets, but many elderly have a mortgage. Furthermore, there are large disparities between ethnic groups across home equity and income-generating assets. Southeast Asian elderly are at particular risk of living in poverty with little or no assets.
Introduction
Asian Americans are often portrayed and perceived as wealthier, better-educated, and more financially secure than other minority racial groups. However, because socioeconomic statistics and studies on Asian Americans often aggregate data for all Asians as a homogenous group, the wide variation between Asian ethnic groups and the current reality of poverty and wealth for these communities are obscured. Asian Americans have systematic differences, structural heterogeneity, and economic disparities, with overrepresentation at the high and low ends.[2] These differences are structured around ethnicity and nativity, which in turn are associated with variations in immigration, education, marketable skills, human capital, and acculturation. For example, there are particularly glaring differences between economic immigrants, such as the highly educated, skilled, and relatively affluent immigrants from China and India who come to the US seeking economic opportunities, and many Southeast Asian immigrants who arrived as political refugees with fewer marketable skills and very little capital.[3] Whereas previous reports examine economic disparities among Asian Americans more generally, this report focuses on these disparities as they relate to Asian American elderly.
Among Asian Americans, the elderly is an often overlooked group, despite literature showing they are among the fastest-growing demographics in the United States.[4] By 2040 one in five US residents will be sixty-five years or older.[5] Among Asian American elderly, their share of the Asian American population is set to grow in the next twenty-five years from 10 percent of the Asian American population to 16 percent.[6] In order to develop a more inclusive, fair, and comprehensive narrative about ethnic inequality, we require an understanding of the economic state of Asian American elderly. This paper fills the knowledge gap examining the heterogeneity of wealth among Asian Americans. The research uses data sources and analytic methods to develop a multidimensional understanding of the elderly (persons aged sixty-five years and older). The first section offers an overview of wealth distribution and characteristics of elderly Asian Americans; the second section examines ethnic variations and the factors associated with wealth; and the final section concludes with a discussion of implications.
Asian American Elderly Wealth
Overview of the Data
This section uses the Survey of Income and Program Participation (SIPP) and the Health and Retirement Study (HRS) to provide an overview of key characteristics of the distribution of wealth among elderly Asian Americans.[7] We use data from multiple SIPP panels with a focus on the most recent panel from 2008. We selected 2008 SIPP data from Wave 10 Core microdata, which includes information on general demographic and socioeconomic characteristics and program eligibility. The Wave 10 Topical Module file allows us to derive wealth information (total net worth, total debt, etc.). We restricted the sample to Asian elderly, those aged sixty-five years and older, who are not residing in group quarters and are designated as the reference person or householder.[8] Setting these criteria resulted in a total sample size of 116 Asian elderly households for the SIPP.
The second dataset for the analysis is the 2014 public-use version of the HRS. The HRS is a longitudinal survey conducted every two years on retirement and health among those aged fifty and older in the United States. The survey is produced and distributed by the University of Michigan, with funding from the National Institute on Aging and the Social Security Administration. As discussed earlier, one of the major limitations of the HRS is its small sample size for Asian Americans, which is folded into the “other” race category in the dataset. This category includes all other groups who are not White or Black. Given this limitation, we separated out Asian Americans by extracting from those who are designated as “other” race individuals who are also foreign born and “non-Hispanic.”[9] The HRS results reported in this paper are therefore presented for estimated non-Hispanic, foreign-born Asians. However, using the ACS public use microdate sample (PUMS), we find the majority, or 88 percent, of Asian elderly are foreign born.
Unlike SIPP, the HRS does not include a variable identifying the “reference person” or “head of household.”[10] In order to come close to obtaining household-level data with one record for each household (done in SIPP using the reference person), we used the oldest person in the household as a proxy to represent the “reference person.” Applying all the criteria leaves us with a total sample size of eighty-eight elderly Asian households.
Inequality in Wealth is Greater Than Inequality in Income
We first examine the relationship between income and wealth—with wealth defined as all assets that have financial value—using SIPP and find that both are correlated with a Pearson’s correlation coefficient of 0.34 and a p-value of less than 0.001.
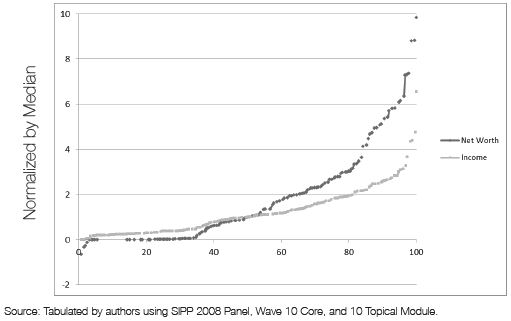
Figure 1. Net Worth and Income of Asian Elderly Households by Percentile
The distribution of the two can further be observed in Figure 1. The x-axis represents income and wealth ranked from lowest to highest; the y-axis represents both measures normalized by the median for each. Households in the bottom half proportionally have far less wealth than income, while households in the top half proportionally have more wealth than income, illustrating greater inequality. In other words, the bottom half of the distribution is poorer in wealth relative to their income standing and the upper fiftieth percentile is richer in wealth relative to their income. Because the poor have limited assets, much tied to home equity among the few who are homeowners, they cannot offset their low income by drawing on accumulated assets.
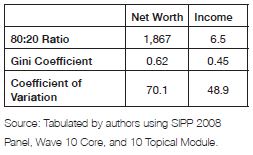
Table 1. Measures of Inequality
Three different metrics were further used to examine the distribution of wealth and income among Asian American elderly: an 80:20 ratio, a Gini coefficient, and a coefficient of variation (CV). The 80:20 ratio is calculated as the wealth (or, alternatively, income) at the top eightieth percentile divided by the wealth at the twentieth percentile. The Gini coefficient is a second, widely accepted measure of inequality reported with a score between zero and one, with zero representing perfect equality and one indicating perfect inequality. The CV is calculated by dividing the standard deviation of the wealth distribution by its mean. More equal wealth distributions will have smaller standard deviations; as such, the CV will be smaller in more equal societies.[11] All measures consistently show the distribution of net worth is a more unequal than income. The Gini coefficients between measures, for example, is 0.45 for income, but 0.62 for net worth (see Table 1).
Income inequality for elderly Asian Americans seems to mirror the inequality of society as a whole. The statistics confirm wealth is considerably more unevenly distributed. This can be seen in both the Gini and CV. What is astonishing is the 80:20 ratio, which indicates that for every dollar an elderly Asian household at the twentieth percentile has in wealth, the household at the eigtieth percentile has roughly $1,900. As with income, the rough magnitude of inequality for elderly Asian Americans is comparable to that reported for other groups, indicating the wealth inequality affecting the nation is also afflicting elderly Asian Americans.
Home Equity and Other Assets
Using the SIPP, we examined the role of homeownership in assets. We find that ownership varies with income and wealth. The poor are predominantly renters, and the rich have higher homeownership rates. Among homeowners, many still have a mortgage to pay (roughly a quarter of elderly Asian households). Among those with housing debt, equity increases with home value and years in the unit. Mean and median net worth and home equity are reported in Table 2 and are broken down by wealth quartiles. Based on our analysis, among all elderly Asian households, home equity accounts for more than half of net assets and an even higher proportion for those in the middle. We test whether the difference between quartiles is statistically significant using an analysis of variance (ANOVA) test. For each of the measured outcomes, the differences in means by wealth category are statistically significant at the p < 0.001 level.
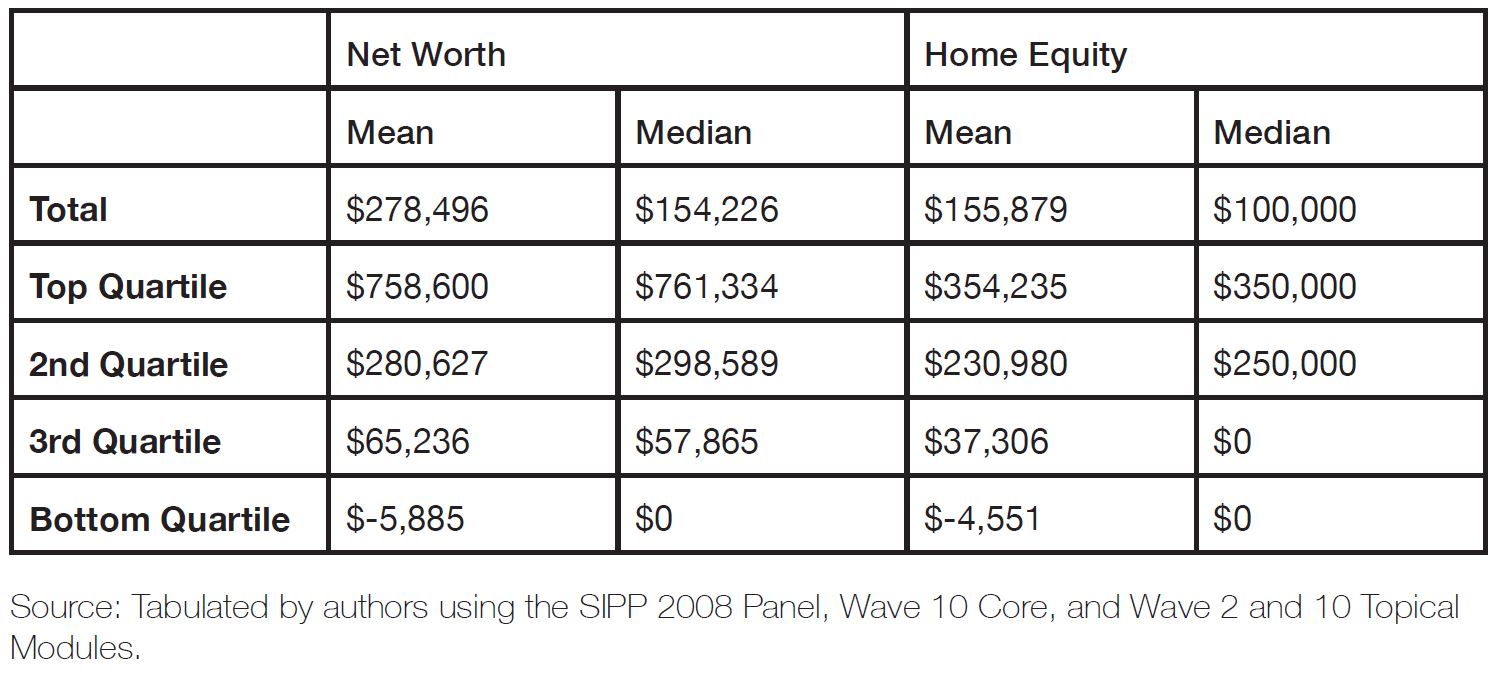
Table 2. Average Net Worth and Home Equity by Wealth Category
Home equity accounts for a majority of wealth in Asian American elderly households. In addition to home equity, however, wealth accumulation also comes in other forms, including rental properties, stocks, and savings. Table 3 provides a breakdown of some of these asset types using data from the HRS. We find that a large majority of those with certain types of assets also receive income from these sources (rents, dividend, interest, etc.). In other words, the presence of income from these assets can serve as a proxy for having the associated base asset.
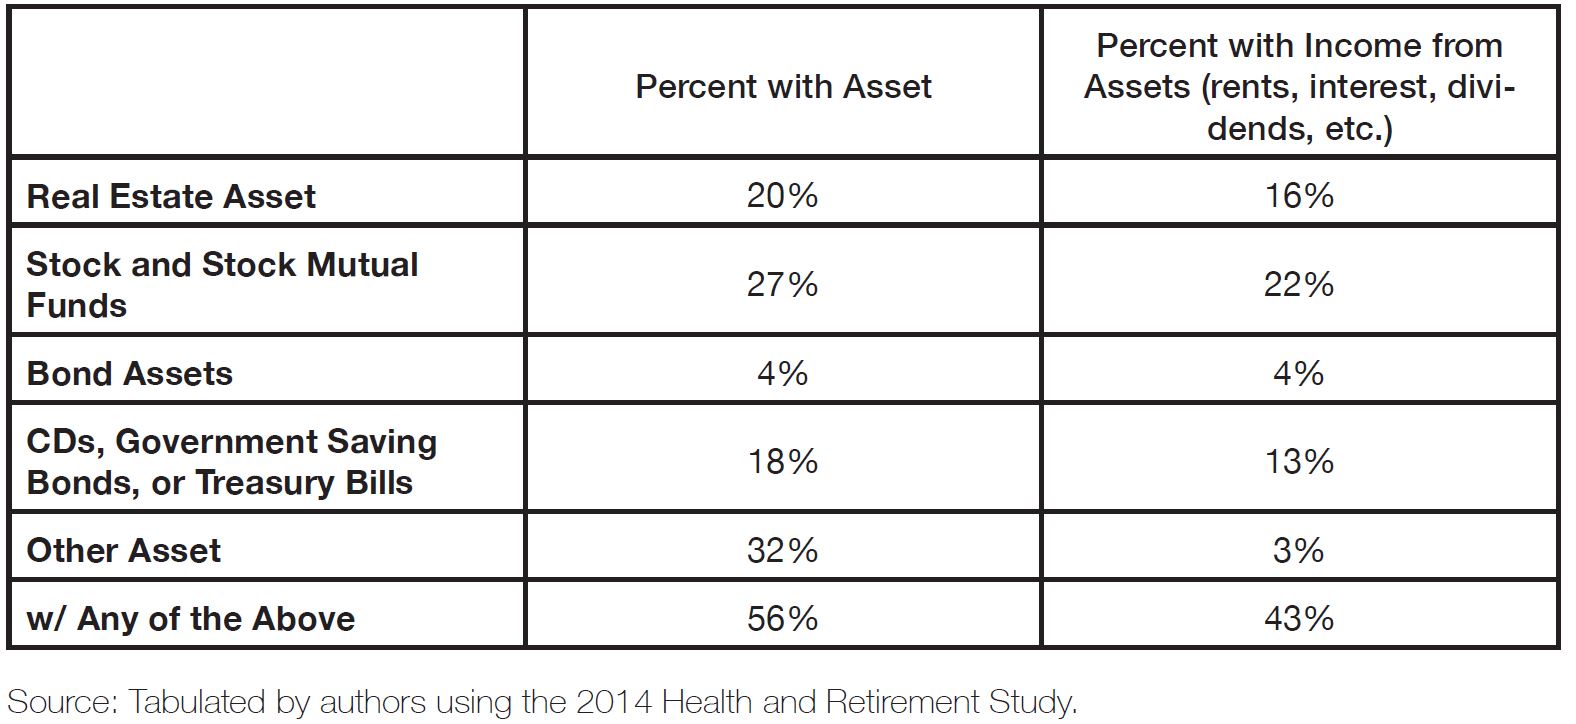
Table 3. Asset Ownership by Types
Ethnic Variations
This section examines variations in wealth among elderly Asian Americans by ethnicity. The analysis is divided into two parts. The first examines variations in homeownership, equity, and income from assets by ethnicity. The second examines the major factors associated with these outcomes. The analysis is based on data from the 2012, 2013, and 2014 ACS PUMS. With its relatively large sample size, the ACS allows us to disaggregate the information by Asian ethnic subgroups. Despite its larger sample size, however, the ACS has only limited and indirect data on wealth. Nevertheless, we can examine two major indicators as a proxy for wealth identified in the analysis of SIPP. Based on our analysis, the first is homeownership; the second is housing equity, which makes up more than half of total net wealth, and even more for those in the middle of the economic distribution (see Table 2). In the ACS, housing tenure is directly reported, and home equity is estimated (see Table 4). For homeowners without mortgage or who are “free and clear,” home equity is set to equal home value, which is self-reported in the ACS. Equity is estimated for homeowners with a mortgage using regression results from the SIPP. With the SIPP, we model home equity for homeowners with a mortgage where equity is a function of home value and years in the unit.
The sample for this analysis is restricted to only those households with an elderly Asian (aged sixty-five and older) who is designated as the reference person. The resulting pooled sample has 23,917 households. Individual estimates are reported for those subgroups that had a minimum sample size of at least one hundred elderly households.[12]
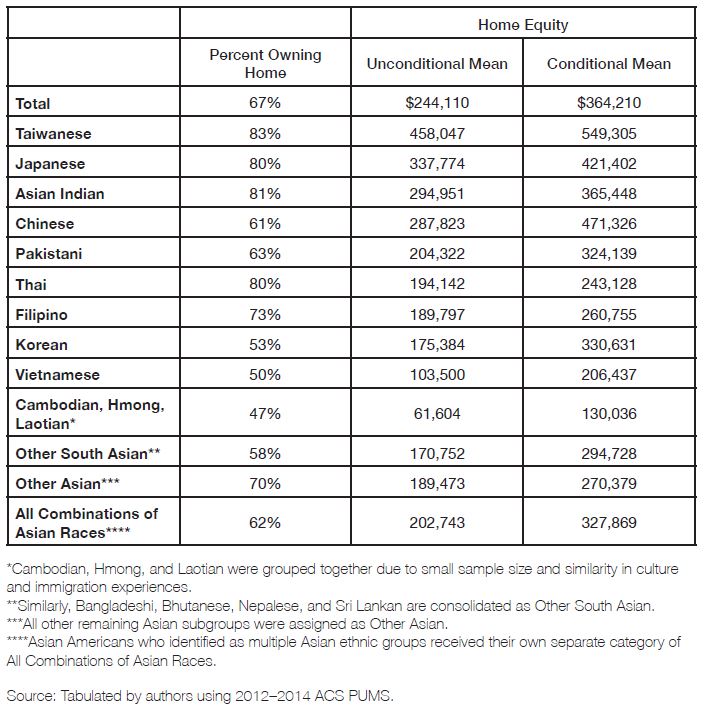
Table 4. Homeownership Rate and Mean Home Equity
Home Equity and Income from Assets
About one-third of elderly Asian Americans own their home. There are ethnic variations in homeownership with Taiwanese, Asian Indian, and Japanese more likely to own homes, with homeownership rates of 80 percent or more, and Southeast Asians being the least likely, with an observed rate of less than 50 percent (see Table 4). We also observe differences in the mortgage status of homeowners. Overall, nearly 44 percent of all elderly Asian homeowners still owe mortgages on their homes. These rates also vary across groups, with Filipinos (62 percent) having the highest mortgage rate, and Chinese (31 percent), the lowest. Table 4 reports both the unconditional and conditional mean home equity, presented in ranked order from highest to lowest by the unconditional mean. The unconditional mean takes into account households with zero home equity (including renters), and it allows us to examine where each group stands overall. The conditional mean is the mean value of equity restricted to only homeowners. As with homeownership, there are also differences in equity by subgroups. Once again, Taiwanese, Japanese, Asian Indian, and Chinese have the highest home equity and Southeast Asians have the lowest, which in large part may also be due to their lower homeownership rates. The ANOVA test shows at least one of the mean home equity values differs from the other ethnic groups, and there is a strong evidence to reject the null hypothesis with p-value < 0.001.
Income from assets is the second wealth indicator examined. The ACS defines asset income as “interest on savings or bonds, dividends from stockholdings or membership in associations, net income from rental of property to others and receipts from boarders or lodgers, net royalties, and periodic payments from an estate or trust fund.”[13] Information on income from assets, however, is collected only at the person level. In order to get household level data on asset income, we aggregated the income from assets for all individuals in the same household.
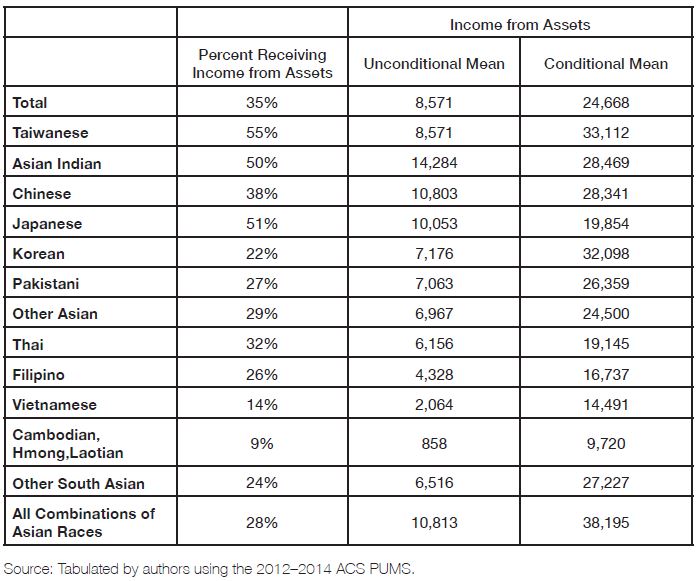
Table 5. Receiving Income from Assets
Table 5 reports the percentage of households in each ethnic group having asset income and mean asset income. Again, we report both the unconditional and conditional means, and table is rank ordered by the unconditional means. As with the previous analysis on homeownership and equity, there are differences in the distribution of income from assets by ethnicity. More than one-third of all Asian elderly households receive income from assets. At least half of Taiwanese, Asian Indian, and Japanese elderly households have asset income, the highest share among all Asian elderly households. Southeast Asians Thai, Vietnamese, Cambodian, Hmong, and Laotian elderly households rank lowest among the subgroups, being two to three times less likely to have income assets relative to all Asian elderly households (i.e., 9 percent versus 35 percent). We see roughly the same pattern and ranking in terms of the actual amount of the mean income from assets. Strikingly, the mean value for the Southeast Asian groups, Cambodian, Hmong, and Laotians elderly households, for example, have approximately one-tenth the amount of asset income compared to all elderly Asian households. Since the ANOVA test performed indicates at least one of the mean asset income values differs from the other ethnic groups, there is strong evidence to reject the null hypothesis with p < 0.001 level.
Some of the observed differences exhibited in the previous two analyses can be attributed to differences in personal and household characteristics, which can affect individuals’ ability to accumulate wealth through homeownership and income-generating assets (i.e., dividend-paying stocks, bonds). Education and income, for example, are two major socioeconomic variables considered in the literature. Generally, households with higher levels of educational attainment and income are expected to have higher probability of achieving homeownership and a greater likelihood to take in income from assets. A simple correlation between years in school and equity (0.22), as well as income and home equity (0.32), all show positive relationships. These variables are also positively correlated with income from assets and vary across ethnic groups.
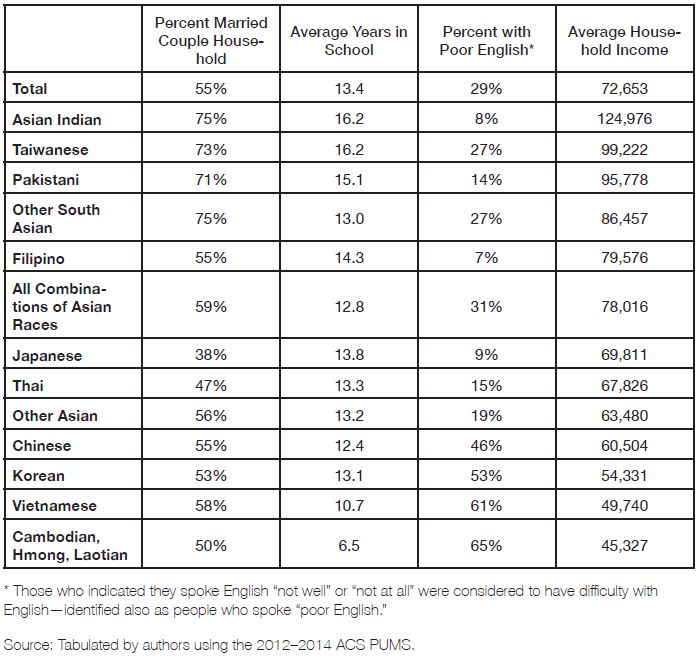
Table 6. Means of Selected Key Variables by Subgroups
Table 6 reports on four key household and personal characteristics. We see noticeable differences in the probability of being a married couple household, years of schooling, English language ability, and household income by ethnic subgroup. There are also huge ethnic variations in English language-speaking ability. Over 60 percent of Vietnamese and Cambodian households have only limited proficiency—speaking it “not well” or “not at all”—while Asian Indian, Filipinos, and Japanese have higher rates of proficiency, with 90 percent or more being proficient. The differences in mean household income are also reported since it is positively correlated with both equity and asset income. Again, we see significant differences in income among subgroups. Southeast Asian households, for example, have a household income that is nearly three times less than that of the highest household income ethnic group (Asian Indians). Although not reported in Table 6, we also observed differences in other key variables including age, percent foreign born, and years in the US. These factors are also related to the ability to accumulate wealth and income. The differences observed in terms of home equity and income assets may further be explained by these personal and household characteristics.
Modeling Homeownership
We use multivariate statistical models to account for the influence of personal and household characteristics and determine if ethnic differences hold, after controlling for non-ethnic independent variables. For each outcome, we ran three separate regression models. The first is a logit model to determine the probability of homeownership and whether the household receives income from assets.
The logistic function is defined as:
Probability (Y > 0) = exp (a+ b Xi +gZi + ei) /(1+exp(a+ b Xi +gEi + ei))
for observation “i” and asset Y (housing equity or asset income) Ì (1,0)
where a is a constant, b is a vector of coefficients, X is the vector of non-ethnic independent variables, g is a vector of coefficients, Z is a vector of ethnicity indicators, and e is s stochastic term. “
The second model is a conditional ordinary least square (OLS) regression that looks at equity among homeowners and income from assets among those who have assets. The conditional OLS regression is defined as:
Yi = (a+ b Xi +gZi + ei)
for observation “i” with asset (housing equity or proxied by asset income) > 0
where a is a constant, b is a vector of coefficients, X is the vector of non-ethnic independent variables, g is a vector of coefficients, Z is a vector of indicators for ethnicity, and e is s stochastic term. “Proc reg” in SAS is used to estimate the model using the sample of Asian American elderly households with assets.
The final model performed is a Tobit model, and it takes account households with zero equity (including renters) and households with no income from asset. The Tobit model is defined as:
Yi* = (a+ b Xi +gZi + ei) e, e|(X,Z) ~ Normal(0,σ2)
and observe only Yi = max(0, Yi*),
where Yi* is the latent variable, a is a constant, b is a vector of coefficients, X is the vector of non-ethnic independent variables, y is a vector of coefficients, Z is a vector ethnic (dummy variables), and e is the stochastic term. The Tobit model estimates both β, yand σ for the model. β and y estimate the effects on X and Z on the latent variable Yi* rather than Y.[16]
Each model contains a set of key control variables. These include variables relating to the demographic characteristics of the reference person such as age; nativity; years in the United States (foreign born); English language-speaking ability; family composition variables, including male- or female-headed household with spouse present (married couple household is the reference group); and socioeconomic variables such as household income and years of schooling. While these variables are consistent across all models, we also included additional independent variables that may be related to one outcome, but not the other. For example, when modeling home equity, we included a dummy variable for homeowners without a mortgage because generally those who are “free and clear” have higher home equity. The full model also includes a set of dummy variables identifying each of the different Asian ethnic subgroups. The ethnicity category for Taiwanese was used as the reference group—the excluded group—in the model because they have the highest mean home equity and the highest income from assets (unconditional mean) among all of the elderly Asian subgroups reported in this study. In the next section, we present our multivariate analysis.
Ethnic Differences in Homeownership and Equity
This section reports on the analysis of and findings for homeownership and home equity. Logit regressions are used to model the dichotomous homeownership variable, and OLS and Tobit are used to model equity. The coefficients are largely consistent with the predicted impacts (see Table 7). The socioeconomic variables—income and years of schooling—had the expected effects of increasing homeownership and equity. Not surprisingly, we expect to see a decrease in odds of homeownership and equity for individuals with poor English-language ability and foreign-born status. For foreign born, however, we see the number of years in the United States increases the odds of homeownership and home equity. Household composition also has an impact. Non-married, male- and female-headed households are less likely to own a home and, if they do own a home, tend to have lower home equity relative to married couple households. As expected, “free and clear” homeowners—those who have paid off their mortgages—have higher home equity relative to homeowners with a mortgage. These patterns are consistent across all three models.
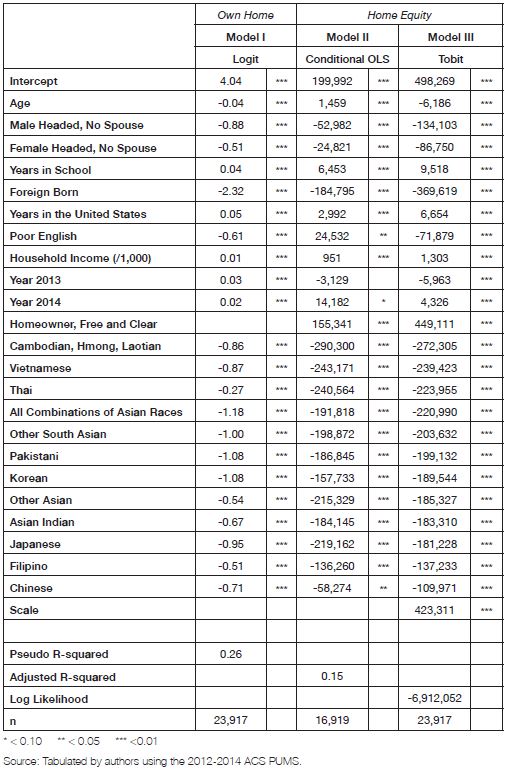
Table 7. Assets in Homeownership, Multivariate Results
The major finding from the models is that many of the observed ethnic differences still hold even after controlling for differences in household and personal characteristics. Relative to the Taiwanese subgroup, all other ethnic subgroups had lower odds of homeownership and lower home equity. The magnitude of the gap varied across subgroups.
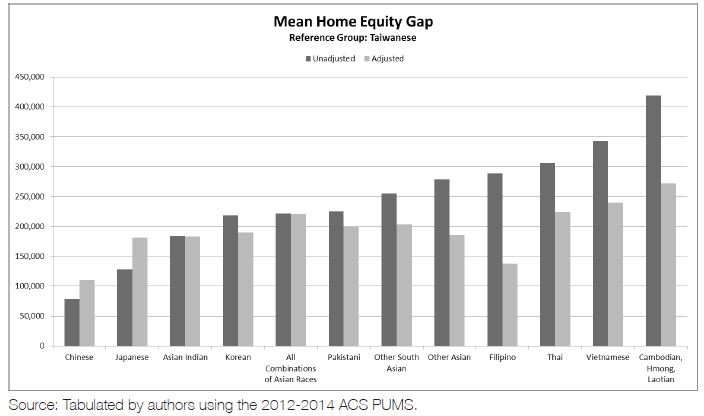
Figure 2. Mean Home Equity Gap Relative to Taiwanese
Figure 2 shows the differences among ethnic subgroups in unadjusted and adjusted mean home equity for households with equity. The unadjusted figures are the observed mean differences and do not control for any of the observed differences in personal and household characteristics between the selected subgroups and Taiwanese subgroup. The adjusted equity differences are the coefficients from the OLS regression and control for differences in personal and household characteristics. Each bar shows the equity held by each ethnic subgroup relative to the Taiwanese subgroup. The chart is ordered from groups with the smallest to largest unadjusted equity gap relative to Taiwanese. As discussed earlier, the gap between Chinese, Japanese, Asian Indian, and Korean is smaller, relative to Taiwanese compared with that of Southeast Asians. Controlling for variables helps explain some of these differences, particularly for Filipino and the Southeast Asian groups. For the more prominent Asian subgroups, such as Asian Indians and Koreans, they only slightly lower the gap. For Chinese and Japanese, the control variables actually increase the gap; nonetheless, their gap relative to Taiwanese remains significantly smaller than those exhibited by Southeast Asians.
Ethnic Differences in Asset Income
The last section examines differences in the probability of receiving income from assets. Table 8 reports the regression results for the three different models. Model IV models the probability of receiving asset income, and Models V and VI model the actual income received from assets. As with the previous analysis on homeownership and equity, we see similar patterns and effects of the independent variables. The probability of receiving asset income increases with age, years of schooling, being married with a spouse present in the household, being US-born, and having more household income. Conversely, the probability of receiving asset income decreases for unmarried householders, foreign-born individuals, and those who with poor English language-speaking ability. These patterns are consistent across all three models, and each control variable is statistically significant.
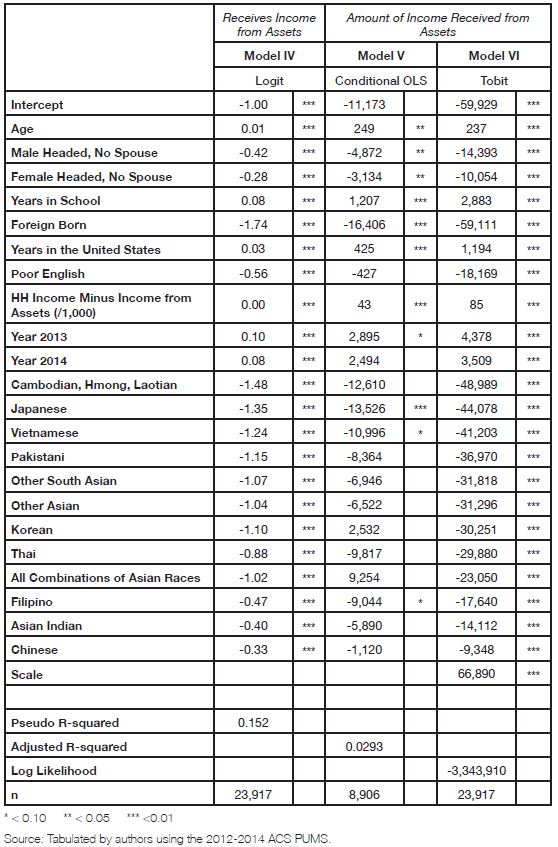
Table 8. Income from Assets, Multivariate Results
A key finding for this paper is that ethnic differences persist after controlling for factors associated with the probability of receiving income from assets. In large part, most of the observed ethnic stratification observed in home equity still holds even with control variables. Relative to Taiwanese, all groups, again, have lower odds of receiving income from assets, but the odds ratiso are much higher for Cambodian, Hmong, and Laotians and lower for Chinese and Asian Indian, after adjusting for the aforementioned factors.
There are shifts in the ethnic ranking. For example, after accounting for variables associated with receiving asset income, the ranking for elderly Japanese drops and their odds of receiving income from asset nears that of Cambodian, Hmong, and Laotians. Elderly Filipinos, by contrast, move up in their ranking closer to that of Chinese and Asian Indian, which suggests the difference observed in asset income relative to Taiwanese is larger due to differences in personal and household characteristics compared to difference observed in home equity. These patterns are consistent in the Models V and VI. And, while most of the ethnic variables in the conditional OLS models are insignificant, in large part due to the model’s smaller sample size (it is restricted to only households with asset income), the coefficients for Japanese and Filipinos are significant. The Tobit model has a larger sample size since it includes observations with zero asset income. The findings show all of the ethnic coefficients being statistically significant.
Figure 3 shows the ethnic differences in both unadjusted and adjusted asset income among those with asset income. Taiwanese are the reference group. Each bar represents the mean difference or gap in asset income between the listed ethnic group and Taiwanese. The smallest gaps observed were those between Taiwanese and Koreans, Taiwanese and Asian Indians, and Taiwanese and Chinese. The gap between Taiwanese and Southeast Asians—Cambodian, Hmong, Laotian, and Vietnamese—is the greatest among ethinic group differences.
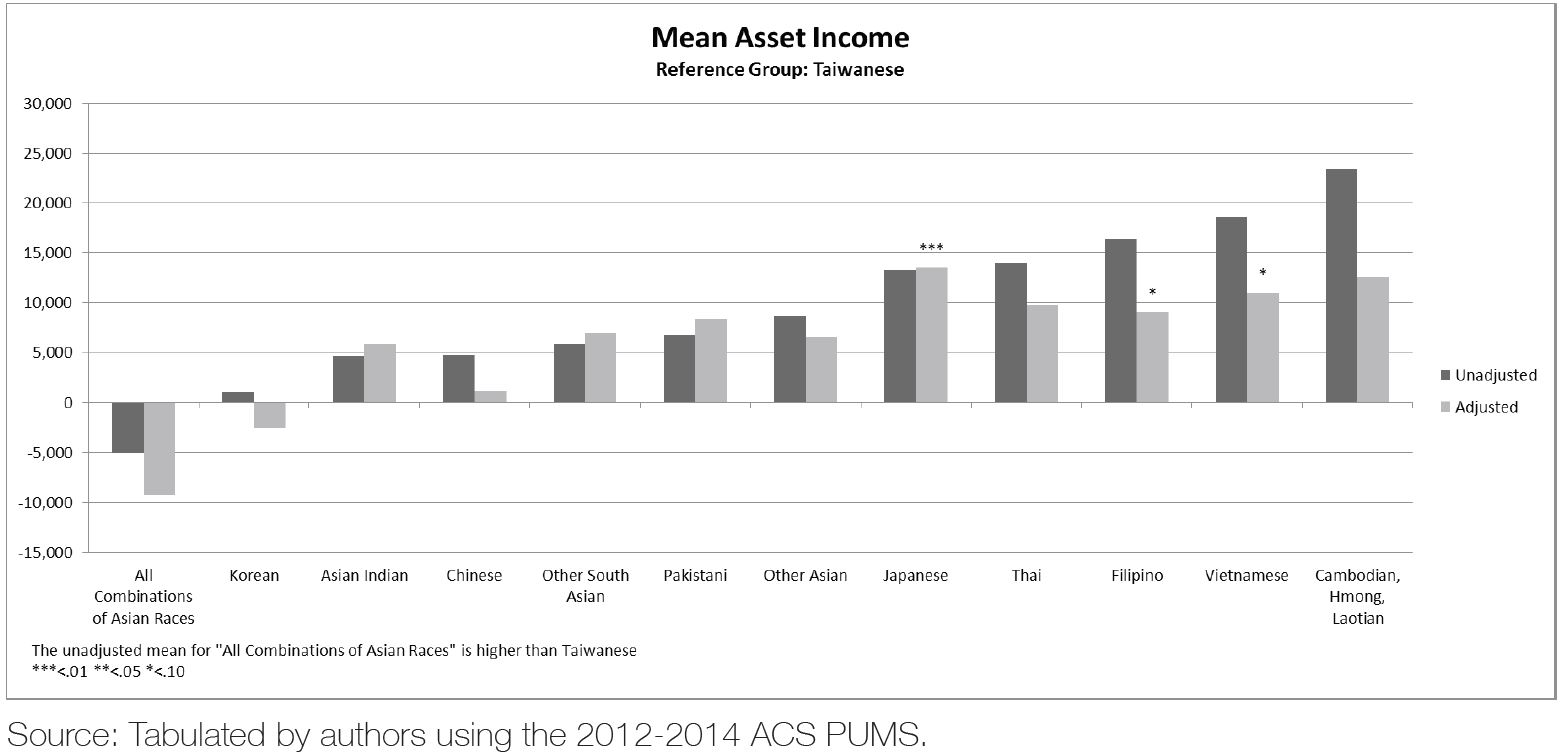
Figure 3. Mean Asset Income by Ethnic Differences
Conclusion
Asian American elderly are not homogenous. Like other elderly populations, a significant proportion has income below the federal poverty level—13 percent according to the most recent 2015 ACS.[17] At this stage in life, assets are an important source of financial security, enabling individuals who are no longer working to live off savings. However, this is not the case for all Asian Americans as seen in sizable subgroup differences. Fourteen percent have zero wealth and more than half (58 percent) have less than $250,000 in assets (which would yield about $10,000 annually to cover expenses using the common 4 percent rule for dissaving). Taking out the net value of the home, only one-sixth have at least $250,000.
Low wealth is correlated with high poverty rates among the elderly. Thirty percent of the elderly Asian Americans in the second-lowest wealth quartile have income below the federal poverty level, and 43 percent of those at the bottom wealth quartile fall below the federal poverty level. Among those with income below the federal poverty level, 22 percent have no assets and 93 percent have less than $250,000. Wealth inequality has an ethnic dimension. Using the ACS proxies, the worst-off group has between 13 percent and 24 percent of home equity and 5 percent and 30 percent of asset income of the most affluent group. The rank order of wealth, not surprisingly, is correlated with intergroup differences in income and poverty. Three Southeast Asian refugee populations—Cambodian, Hmong, and Laotian—for example, rank at or near the bottom of the economic ladder along three dimensions: wealth, income, and poverty.
These ethnic variations are a product of policy-based migration patterns that cream the most educated from some nations and admit the most disadvantaged, such as the humanitarian flow of Vietnamese immigrants after the Vietnam War.[18]
Given the magnitude and nature of wealth inequality—and its correlated income inequality—policies that address the needs of impoverished elderly must be inclusive of Asian Americans and made accessible for the groups in greatest need. In our opinion, this includes affordable housing, support services, and health care programs that are culturally and linguistically appropriate, and, therefore, more accessible for the many Asian American elderly who are in need and who may also be linguistically isolated, as 30 percent of Asian American elderly households are linguistically isolated.[19] Having identified ethnic groups in the greatest need, it is imperative that some resources be dedicated to ensuring programs and support services actually reach these elderly.
Meaningful implementation of such policies and programs requires detailed information. While this study produced new empirical insights, one conclusion is that current data on wealth are insufficient to adequately examine Asian American elderly. For example, the major surveys have relatively small samples and few questionnaires are translated into Asian languages. Additionally, the datasets do not fully identify Asian American respondents, and agencies do not adequately fund research for this population. We believe it is critical that government- and foundation-supported surveys include adequate samples of Asian Americans—including a strategy to oversample—that the data is sufficient enough to be disaggregated by ethnicity and nativity, and that Asian Americans are systematically and explicitly analyzed. The Ford Foundation’s “Building Economic Security over a Lifetime” initiative is an example of how this can be implemented. The results will greatly enhance our ability to identify and address the financial challenges facing elderly Asian Americans. Additional research is needed to address where specifically policies and systems of support for the elderly are missing for AAPI elderly and subgroups. However, based on our findings, we have been able to identify groups who may face the challenges of poverty and low wealth. Because we have found wealth inequality to exist among ethnic lines, a first step toward reaching these groups in need may be to ensure culturally and linguistically appropriate programs for those groups.
References
[1] This project is made possible by the generous support of the Ford Foundation’s Building Economic Security over a Lifetime initiative. We would like to thank Jenny Chhea for her assistance in the early data work and assessment. The authors are also grateful to Melany De La Cruz-Viesca, assistant director of the UCLA Asian American Studies Center and Silvia Gonzalez from the UCLA Center for Neighborhood Knowledge for their support and technical assistance.
[2] Ong, Paul, “Asian American Pacific Islander Economic Justice,” AAPI Nexus Journal: Policy, Practice, and Community Vol. 14, No. 1 (Los Angeles: UCLA Asian American Studies Center Press, 2016): 30-48.
[3] The New Asian Immigration in Los Angeles and Global Restructuring, eds. P. M. Ong, E. Bonacich, and L. Cheng, (Philadelphia: Temple University Press, 1994).
[4] He, Wan, Manisha Sengupta, Victoria A. Velkoff, and Kimberly A. DeBarros, “65+ in the United States: 2005,” US Department of Commerce, Economics and Statistics Administration, Bureau of the Census, 2005.
[5] Ong, Jonathan, Paul Ong, and Elena Ong, “The Future of Asian America in 2040,” AAPI Nexus Journal: Policy, Practice, and Community Vol. 14, No. 1 (Los Angeles: UCLA Asian American Studies Center Press, 2016): 14-29.
[6] Ibid.
[7] The SIPP is administered by the Census Bureau, and its purpose is to collect information on “various types of income, labor force participation, social program participation and eligibility, and general demographic characteristics to measure the effectiveness of existing federal, state, and local programs.” Because of small sample sizes, we are unable to examine nativity and ethnic differences with either dataset. However, the datasets are useful because they include information on net wealth, home equity, and income, including income from assets.
[8] According to the US Census Bureau, “[T]he householder refers to the person (or one of the people) in whose name the housing unit is owned or rented (maintained) or, if there is no such person, any adult member, excluding roomers, boarders, or paid employees. If the house is owned or rented jointly by a married couple, the householder may be either the husband or the wife. The person designated as the householder is the ‘reference person’ to whom the relationship of all other household members, if any, is recorded.”
[9] By adding the foreign-born-only restriction, we exclude two other major racial groups that could potentially be collapsed under the “other” race category, but who are primarily native or US born. These include American Indian/Alaskan Natives and Native Hawaiians. By further restricting the sample to non-Hispanic foreign born, we exclude Hispanics who proportionally make up the largest share of foreign-born people. Asians are the second-largest foreign-born group following Hispanics.
[10] Instead, it includes a “First R,” which is the first respondent interviewed in a household in a given wave; “Family R,” which answers child and household member related questions; and a “Financial R,” which answers the money questions for a household. However, these assignments can change from wave to wave and neither respondent is considered more important than the other.
[11] De Maio, Fernando G, “Income Inequality Measures,” Journal of Epidemiology and Community Health Vol. 61, No. 10 (London: BMJ Publishing Group, 2007): 849-852.
[12] The following Asian ethnic groups met this threshold and their respective sample sizes are reported: Asian Indian (2,850), Chinese (6,261), Taiwanese (299), Filipino (4,653), Japanese (3,871), Korean (2,510), Pakistani (195), Thai (271), and Vietnamese (1,992). Due to their small size and since these groups share similar cultural and immigration experiences in the US, Cambodian, Hmong, and Laotian were grouped together. Similarly, Bangladeshi, Bhutanese, Nepalese, and Sri Lankan are consolidated as “Other South Asian.” All other remaining Asian subgroups were assigned as “Other Asian.” Asian Americans who identified as multiple Asian ethnic groups received their own separate category of “All Combinations of Asian Races.”
[13] “American Community Survey” and “Puerto Rico Community Survey,” US Census Bureau, 2014.
[14] “Proc logistic” in SAS is used to estimate the model using the sample of Asian American elderly households.
[15] “Proc reg” in SAS is used to estimate the model using the sample of Asian American elderly households with assets.
[16] “Proc Lifereg” in SAS is used to estimate the model.
[17] “American Community Survey 2015 1-Year Estimates,” US Census Bureau, 2015.
[18] “The Political Economy of Capitalist Restructuring and the New Asian Immigration,” The New Asian Immigration in Los Angeles and Global Restructuring, eds. P. M. Ong, E. Bonacich, and L. Cheng, (Philadelphia: Temple University Press, 1994).
[19] Tabulated by authors using 2012-2014 ACS PUMS.
Recommended Citation
Ong, Paul M., Chhandara Pech, and Alycia Cheng. “Wealth Heterogeneity Among Asian American Elderly.” Asian American Policy Review 27 (2017): 15-32.