BY ANDREW DEYE
This piece appeared in our 2015 print journal. You can order your copy here.
POLICY ISSUE OVERVIEW
The United States, once a global leader in infrastructure competitiveness, now ranks 16th.1 The decline shows no signs of abating as federal, state, and local funds for infrastructure remain constrained, and government resources remain centered on health care, social security, and defense.2
Underinvesting in existing and new infrastructure reduces the productive capacity of the US economy. The United States could eliminate this major drag on economic growth and protect against a $3.1 trillion loss in gross domestic product (GDP) through sizable infrastructure investments through 2020, according to a 2013 study by the American Society of Civil Engineers.3 Additionally, there are serious safety concerns about US infrastructure, as evidenced by events such as the I-35W bridge collapse in Minnesota, which took the lives of 13 people and injured 145 others in 2007.4 For both economic and safety reasons, improving US infrastructure should be a bipartisan imperative for the 114th Congress and President Obama.
In an era of limited federal funding for infrastructure, public-private partnerships (P3s) are an increasingly used tool for US state and local governments to bridge resource gaps. This article explores key P3 trends and takeaways from the past decade in the United States and analyzes some of the factors that will determine industry growth going forward. The article also offers specific, tangible evidence of the benefits of P3s in the United States. Specifically, the outcomes achieved on a toll road project in Florida (I-595), a container terminal expansion in the Port of Baltimore (Seagirt), and a new courthouse development in southern California (Long Beach) demonstrate that significant public value can be created through the responsible fusion of private and public sector resources.
PUBLIC-PRIVATE PARTNERSHIPS DEFINED
Numerous definitions of P3s exist. A particularly informative definition comes from PPP Canada, an independent element of the Canadian government, which defines a P3 as a “long-term, performance-based approach to procuring public infrastructure where the private sector assumes a major share of the risks in terms of financing and construction and ensuring effective performance.”5 To further categorize P3s, the presented data on the US market in this article relate to Design-Build-Finance-Operate-Maintain (DBFOM) concessions and transactions with similar mechanics.6
THE DECADE IN REVIEW
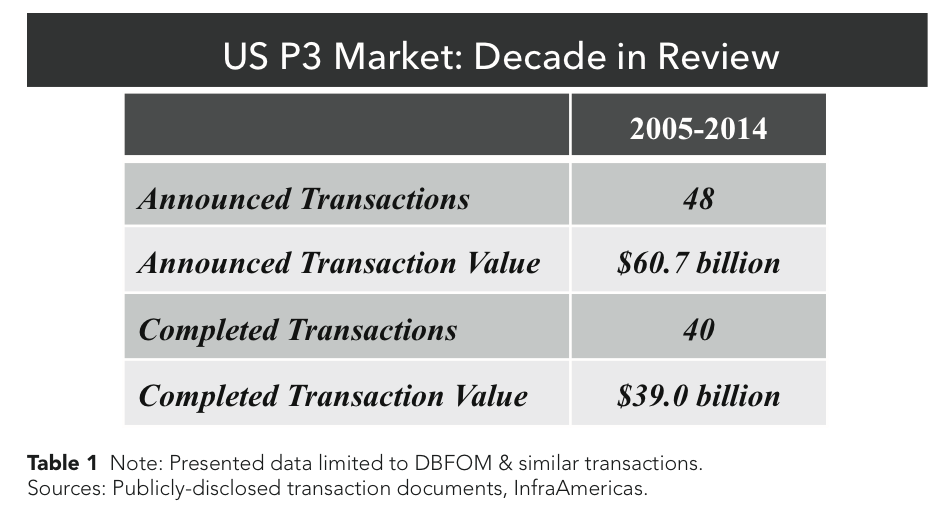
Since the catalyzing $1.8 billion Chicago Skyway lease was completed ten years ago, the US P3 market has developed dramatically. From 2005 to 2014, forty-eight infrastructure P3 transactions with an aggregate value of $61 billion reached the formal announcement phase. Of the forty-eight deals, forty transactions—or more than 80 percent— successfully closed. 2012 was the busiest year on record for P3s that reached financial close, with nine such transactions achieving completion during the year. A summary of historical transaction activity is included in Table 1. Despite a sizable and growing track record, P3 skeptics often narrowly focus on the handful of announced transactions that did not close—most notably, Texas’ $3.5 billion SH-121 (2007), the $12.8 billion Pennsylvania Turnpike lease (2008), the $452 million Pittsburgh Parking concession (2010), and the $2.5 billion Chicago Midway Airport lease (2009, 2013).7 The most common thread in these unsuccessful P3 initiatives is a lack of political consensus to support the underlying project through to completion. If a jurisdiction is divided on partisan or other lines as to whether a P3 is the correct approach, it reduces both the chances of success and the appetite of bidders to present attractive proposals. Without a real consensus at the outset, history suggests that the risk of a P3 being thwarted or mischaracterized by opponents is high. This is true even at the local level in cities that enjoy “municipal home rule,” which generally provides broad legal authority and protection from interference at the state level.8
Political risk, however, was not the only defining characteristic in the early years of the US P3 industry. Financial market conditions also played a fundamental role. In 2008 and 2009, the global financial crisis profoundly reshaped the US P3 market. Prior to the crisis, only ten infrastructure P3 transactions had been announced, reflecting the industry’s nascent stage. The vast majority of P3s from 2005 to 2007 were privatization-style transactions involving “brownfield,” or existing assets. In such transactions, the private sector assumed significant risks and underwrote aggressive assumptions regarding future levels of demand. The largest completed P3 of the pre-financial crisis was the $3.8 billion lease of the 157-mile Indiana Toll Road, which is now undergoing a financial restructuring via Chapter 11 bankruptcy.9 At this point, such privatization transactions—which were highly politicized despite the private sector overpaying—appear to be a relic of the credit bubble and financial history.
Since the crisis, the US infrastructure P3 market has almost entirely shifted away from “brownfield” transactions in favor of “greenfield,” i.e., new-build projects. In a greenfield context, the primary value of the P3 model comes not from monetizing an asset, but rather from delivering a needed project more effectively. Such projects are often tendered by governments as “availability-payment” transactions, which entitle a developer/private consortium to receive periodic payments as long as the asset is “available” to the public at the standards set forth in the contract. Since the first US availability-payment P3 closed in 2009 (the $1.9 billion I-595 express lanes in Florida), a host of other jurisdictions including the state of Indiana and the state of California have successfully used the model, which remains prevalent in Europe, Canada, and Australia.10 In the United States, the most recent availability-payment transaction to close was the $2.3 billion I-4 Ultimate project in central Florida, the largest completed P3 of 2014.11
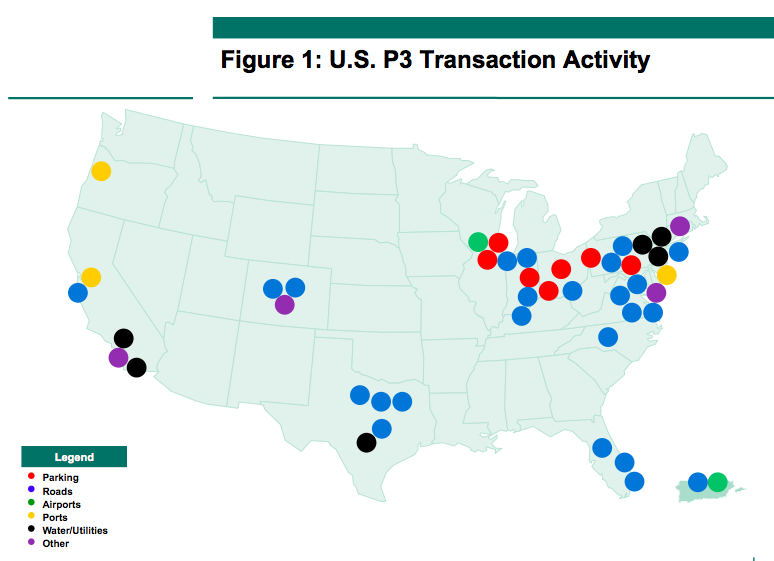
Overall, the US P3 market has successfully transformed from its early days. Transaction structures have steadily changed as governments balance proceeds potential, risk allocation, project delivery costs, and other policy considerations. In this context, the current market for P3s remains robust, as underscored by diverse transaction activity across the United States (see Figure 1).
LOOKING AHEAD
In a September 2014 report, Moody’s Investors Service stated, “the United States has the potential to become the largest P3 market in the world, given the sheer size of its infrastructure.”12 The extent to which this statement will hold true depends on at least three factors:
- Political cycles, particularly the implications of gubernatorial elections;
- The federal government’s continued ability to offer loans and other forms of financial assistance in P3 transactions; and
- The extent to which other funding sources (e.g., gas taxes) grow and lessen the catalysts for P3s.
Political Cycles
In terms of political cycles, it is instructive to look at a case study involving the state of Ohio and the Commonwealth of Kentucky. Since 2012, Ohio Governor John Kasich and Kentucky Governor Steve Beshear have led a bipartisan effort to build a new bridge between Cincinnati, Ohio, and Covington, Kentucky. Specifically, the states issued a request for information regarding the $2.6 billion Brent Spence Bridge Corridor (which carries as much as 4 percent of US GDP13) in 2012 and completed a detailed options analysis in 2013, which included a P3 alternative.14 Yet, despite the bipartisan leadership over a multi-year period, the Kentucky legislature has yet to pass a P3 bill that would allow tolls on the new, to-be-built bridge. Governor Beshear, now in his last year in office, is actively seeking to persuade the legislature to pass a bill to enable tolls and a P3 bid process. Ultimately, if a bid process moves forward, a nationally significant transportation project will be added to the US P3 register. Alternatively, if politics continue to prevent progress, the Brent Spence Bridge initiative could result in zero growth for the P3 market.15
A host of other potential P3 projects share this recurring problem of “political limbo,” including the long-envisioned Illiana Expressway south of Chicago. In that case, the recently elected Governor of Illinois, Bruce Rauner, issued an executive order suspending planning and development of any major interstate construction projects pending additional cost/benefit analyses.16
Federal Support
For transportation projects, the Transportation Infrastructure Finance and Innovation Act (TIFIA) program, originally enacted in 1998, plays an essential role in the US P3 market by providing “credit assistance for qualified projects of regional and national significance.”17 Particularly since the financial crisis (and in light of a 2012 expansion of its lending capacity), TIFIA has been instrumental in facilitating P3 activity.18 Select high-profile projects since 2012 that contained a large TIFIA component included Goethals Bridge ($474 million), Ohio River Bridges ($452 million), I-95 HOT Lanes ($300 million), and Presidio Parkway ($150 million), among others.19 Indeed, without TIFIA, such projects would not have been feasible as P3s. Thus, the extent to which TIFIA assistance remains readily available going forward will directly affect the level of P3 activity. Similarly, in the water and waste-water sector, the recently established five-year Water Infrastructure Finance and Innovation Act (WIFIA) offers hope that new project delivery models can take hold in that sub-sector as well.20
In addition to federal loan programs, the Obama administration recently announced that it would propose “the creation of an innovative new kind of municipal bond, Qualified Public Infrastructure Bonds (QPIBs).”21 If approved as conceptualized, QPIBs would offer a low-cost financing tool to increase private participation in building
US infrastructure. Unlike Private Activity Bonds (PAB), QPIBs would have no issuance caps. The overall impact of QPIBs would be to allow P3s, including transactions involving long-term leases and management contracts, to take advantage of the benefits of municipal bonds.22 If QPIBs are indeed approved by Congress and the President, “brownfield” P3s in particular could reemerge as a source of new infrastructure funding.23
Other Funding Sources
Lastly, it is important to convey that P3s do not operate in a policy vacuum. Policymakers have a range of options to raise money to pay for infrastructure. For instance, if the federal government were to increase the federal excise tax on gasoline of 18.4 cents per gallon, the incremental funding streams to the states could decrease the overall appetite to pursue P3s. However, the federal gas tax has remained unchanged since 1993, and such a scenario is unlikely in the near-term. Indeed, even President Obama recently weighed in stating, “In fairness to members of Congress, votes on gas tax are really tough.”24
CONCLUSION
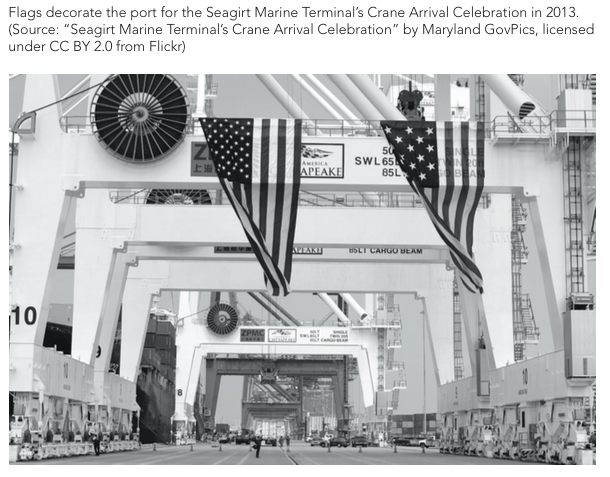
At a conceptual level, the primary drivers of infrastructure P3s—new sources of capital, cost savings, risk transfer, and accountability—remain strong. Government officials at all levels (federal, state, and local) continue to operate in an environment of constrained financial resources and citizen expectations for efficient and timely operations. In Florida, the I-595 P3 provided capacity improvements fifteen years sooner than a conventional plan would have offered.25 In Maryland, an innovative expansion of the Seagirt Marine Terminal in the Port of Baltimore was completed two years ahead of schedule due to the P3 model.26 As a result, the Port of Baltimore is only the second port on the US East Coast to have unrestricted access to both a fully functioning 50-foot channel and 50-foot berth.27 In California, the Administrative Office of the Courts used a P3 to deliver a new 531,000-square-foot courthouse in Long Beach ahead of schedule and under budget.28 While many other successful case studies exist, these three examples—I-595, Port of Baltimore, and Long Beach Courthouse—provide tangible evidence of the value creation potential of P3s in the United States.
In sum, the United States cannot expect to have an “A” economy with “D+” infrastructure.29 P3s, while not a comprehensive policy solution, can help the United States “make the grade” going forward by enabling and accelerating the completion of important projects. A supportive federal government role—whether through existing programs like TIFIA or new initiatives such as QPIBs—will be critical to continuing the growth trajectory of the US market.
Andrew Deye is a mid-career Master in Public Administration candidate at the John F. Kennedy School of Government at Harvard University. Previously, Andrew worked in investment banking for eight years and specialized in advising on public-private partnerships and infrastructure merger and acquisition transactions throughout the United States.
2 Paul Haven, “Issue Brief: Federal Funding for U.S. Transit and Roadway Infra- structure,” Environmental and Energy Study Institute, 8 August 2013.
4 “Friday Marks 7 Years Since I-35W Bridge Collapse,” CBS Minnesota, 1 August 2014.
7 “IV. The Growing Use of PPPs in the United States,” in “Innovation Wave: An Update on the Burgeoning Private Sector Role in U.S. Highway and Transit Infrastructure,” Federal Highway Administration, 18 July 2008; “Driven by Dollars: What States Should Know When Considering Public-Private Partnerships to Fund Transportation,” Pew Center on the States, 24 March 2009; Michael Benouaich, “Making Sense of Recent U.S. Parking-Lease Transactions,” Parking Today, May 2011; “Airport Privatization: Limited Interest Despite FAA’s Pilot Program,” United States Government Accountability Office, November 2014.
8 Stephen Goldsmith and Andrew Deye, “A 5-Part Test for Public-Private Partner- ships,” Governing, 17 December 2014; “PPPs and Municipal Home Rule,” Allen & Overy, Spring 2009.
9 Jacqueline Palank, “Judge Approves Indiana Toll Road Bankruptcy-Exit Plan,” The Wall Street Journal, 28 October 2014.
10 “Introduction to Public-Private Partnerships with Availability Payments,” Jeffrey A. Parker & Associates, Inc., 2009.
11 “Governor Rick Scott Breaks Ground on I-4 Ultimate Project,” Florida Governor’s Press Office, 17 February 2015.
12 “Public-Private Partnerships – Global P3 Landscape: A Region-by-Region Round-Up,” Moody’s Investors Service, 8 September 2014.
13 “Senate Session,” C-SPAN, 3 November 2011.
14 HNTB Corporation, “Brent Spence Bridge Project Options Analysis,” Ohio Department of Transportation and Kentucky Transportation Cabinet, September 2013.
24 Scott Horsley, “Obama Talks Gas Tax And Visas With Business Leaders,” NPR, 3 December 2014.
25 Joe Borello and Paul Lampley, “I-595 Public Private Partnership (P3) Presentation for Talking Operations Webinar,” Florida Department of Transportation, 7 July 2010.
26 “Governor O’Malley Leads Celebration of New 50-Foot-Deep Berth and Supersized Cranes at Port of Baltimore,” Maryland Department of Transportation, 8 May 2013.


