In 2013, President Barack Obama give his first major speech on income inequality. He called inequality the “defining challenge of our time” and said that his administration would seek to combat inequality during his final years in office.
President Trump hasn’t applied the same focus to this issue — Twitter apparently isn’t a good forum for in-depth conversations on economics. But the president’s lack of focus shouldn’t distract us from recognizing that inequality is still an incredibly important issue. For most American households, the rise of inequality decreases their income by thousands of dollars every year.
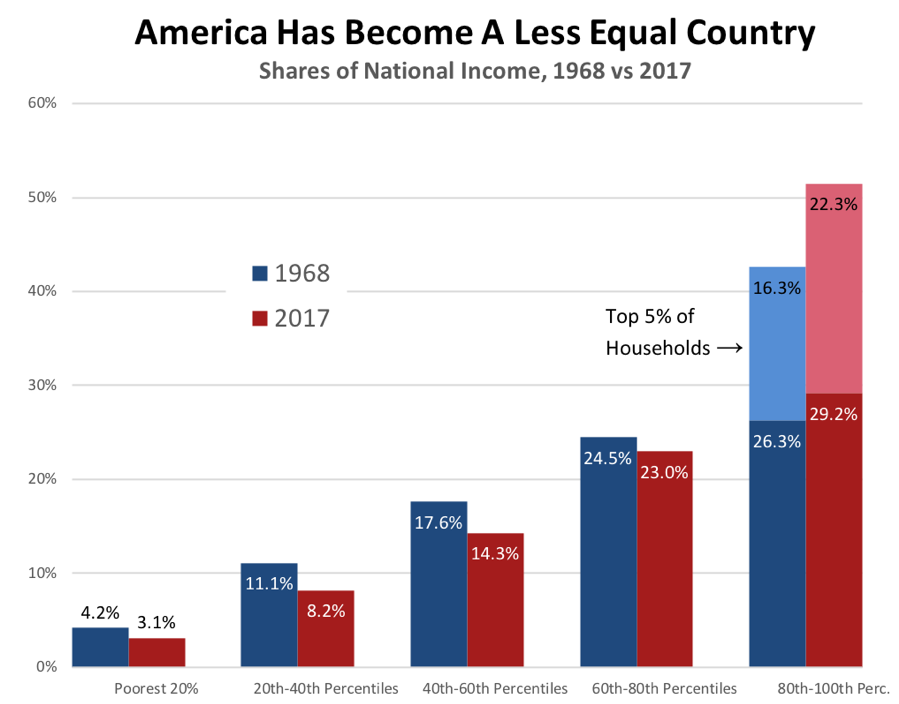
By looking at changes in the distribution of household income, we can see that inequality has risen substantially over the past 50 years:
 Data: United States Census Bureau (2018).
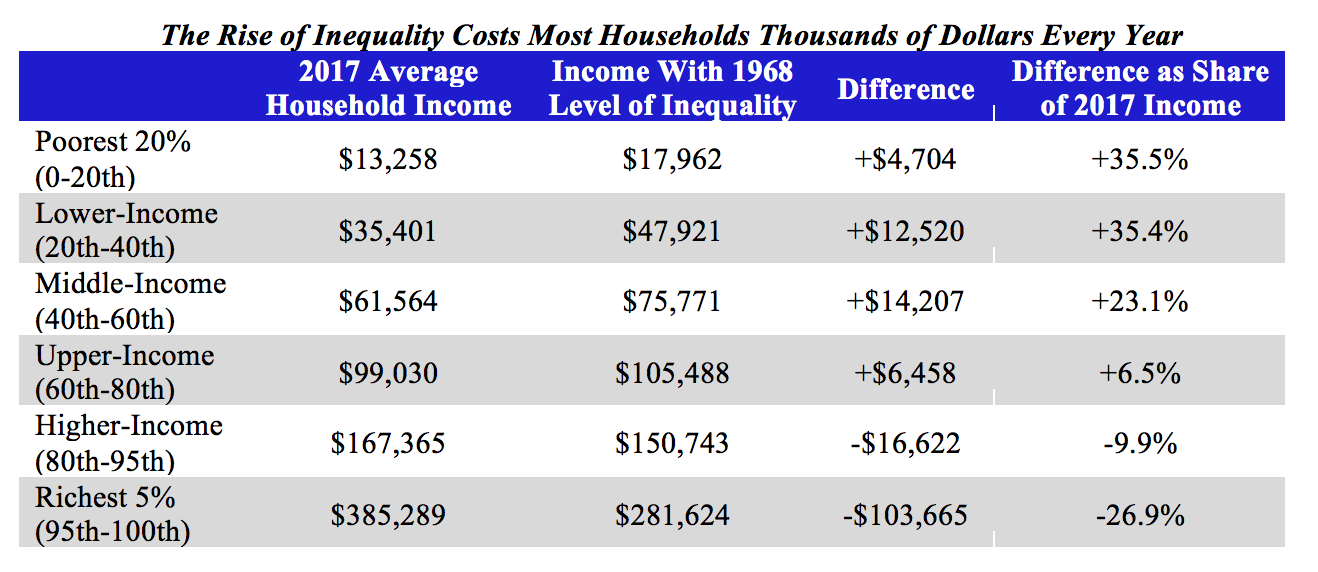
The table below takes these calculations a step further by breaking American households into six different groups based on their 2017 incomes. The second column shows each group’s average household income in 2017; the third column shows what the group’s average income would have been if inequality had not risen since 1968. The fourth and fifth columns depict the cost of inequality; they show how much higher or lower household incomes would’ve been in 2017 if we had the same distribution of income that we had in 1968.
 Source: Author’s calculations based on data from the Census Bureau (2018).
The results are striking because inequality has gone up so much. Were it not for the increase in inequality, the incomes of households in the bottom 40 percent of the income distribution would be over 35% higher than they are today. Lower-income households lose over $12,500 per year, while middle-income households lose over $14,200. Even relatively well-off households – those with an average annual income of $99,000 – lose close to $6,500 per year.
Meanwhile, the richest fifth of households have benefited from the increase in inequality, but not nearly as much as the top 5 percent. Upper-income families – those in the top 20 percent of the income distribution but not in the top 5 percent – would see their annual incomes drop by $16,600 if we were to return to the 1968 distribution of income. By contrast, those in the top 5 percent would see their annual incomes drop by $103,700. In other words, a very small group of incredibly rich Americans – not a large group of well-educated, upper-middle-class workers – are the primary beneficiaries of rising inequality. Three professions, in particular, have benefited disproportionately from this rise: executives, managers, and supervisors; those in the financial sector; and physicians.
Now, any time you talk about household income statistics, conservatives invariably respond with one argument: “household” income is a misleading measure of economic well being, since households of different sizes should be expected to have different incomes. For example, if a married couple has a combined income of $80,000, then their household income would be considered twice as high as the $40,000 income of a single person. Conservatives have seized on this point to argue that household income statistics overstate both the present level of inequality and also the increase in inequality over time.
They are wrong on both counts. The Census Bureau actually publishes “equivalence-adjusted income shares” which control for differences in household size and composition. The word composition mostly refers to age differences – as any parent will attest, it is far more expensive to buy food for a 15-year-old than for a 3-year-old. In 2017, the equivalence-adjusted distribution of household income looked virtually identical to the regular household income distribution. For example, the “unadjusted” income statistics show that the poorest fifth of households took home just 3.1% of the nation’s income; similarly, their share of equivalence-adjusted income was 3.5%. If this is what conservatives are banking on to argue that income inequality is just a statistical illusion, they don’t have much of an argument.
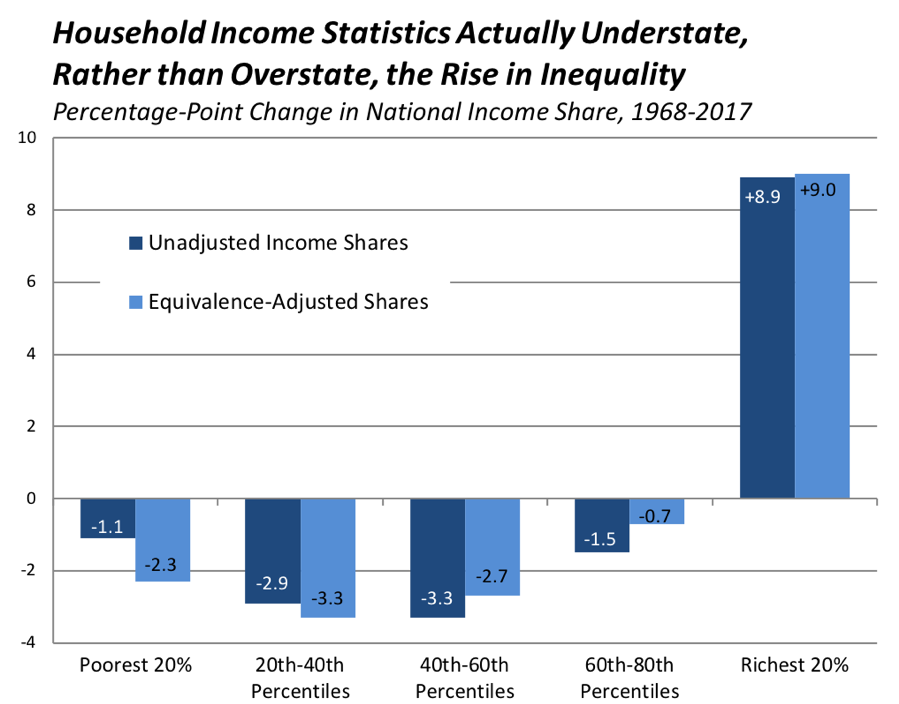
Moreover, the normal, unadjusted income statistics actually understate the increase in inequality over time:
Source: Author’s calculations based on data from the U.S. Census Bureau (2018).
As we see in the figure above, the poorest fifth of households saw their share of national income decline 1.1 percentage-points from 1968 to 2017. By contrast, their share of equivalence-adjusted income fell 2.3 percentage-points, a difference that may seem small but amounts to twice the dollar value in income.
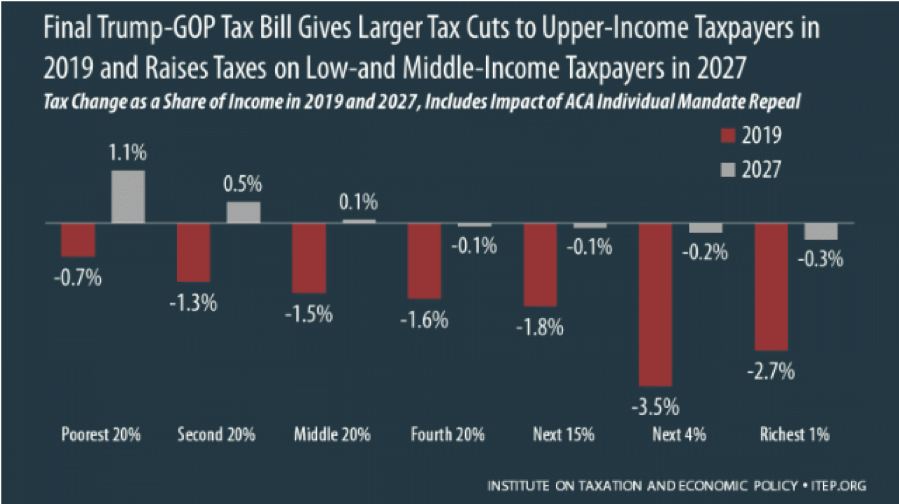
The Trump tax reform only serves to exacerbate this problem. In 2019, taxes will be only slightly lower for the poor, while they will be substantially lower for the rich. By 2027, most Americans in the bottom half of the income distribution will see a tax increase, while those at the top will continue to receive a cut:
Although “income inequality” may seem like an abstract concept to many, its rise has been both real and pernicious. Were the country to return to the same distribution of income as it had in 1968, the incomes of poor and low-income people would rise over 35%. Reversing this increase will be difficult, but it’s not impossible.

Nick Buffie is a first-year Master’s in Public Policy student at the Harvard Kennedy School (HKS). Before coming to HKS, Nick spent three years working at two economic policy think tanks in Washington, DC. His research on health care reform, tax policy, labor markets, and other topics has been cited in the New York Times, the Washington Post, Meet the Press, National Public Radio, and other nationally syndicated media outlets.
Edited by Dee Yusuf